Run (Pipeline Execution)
Execute inspection pipelines in acquisition or inference mode.
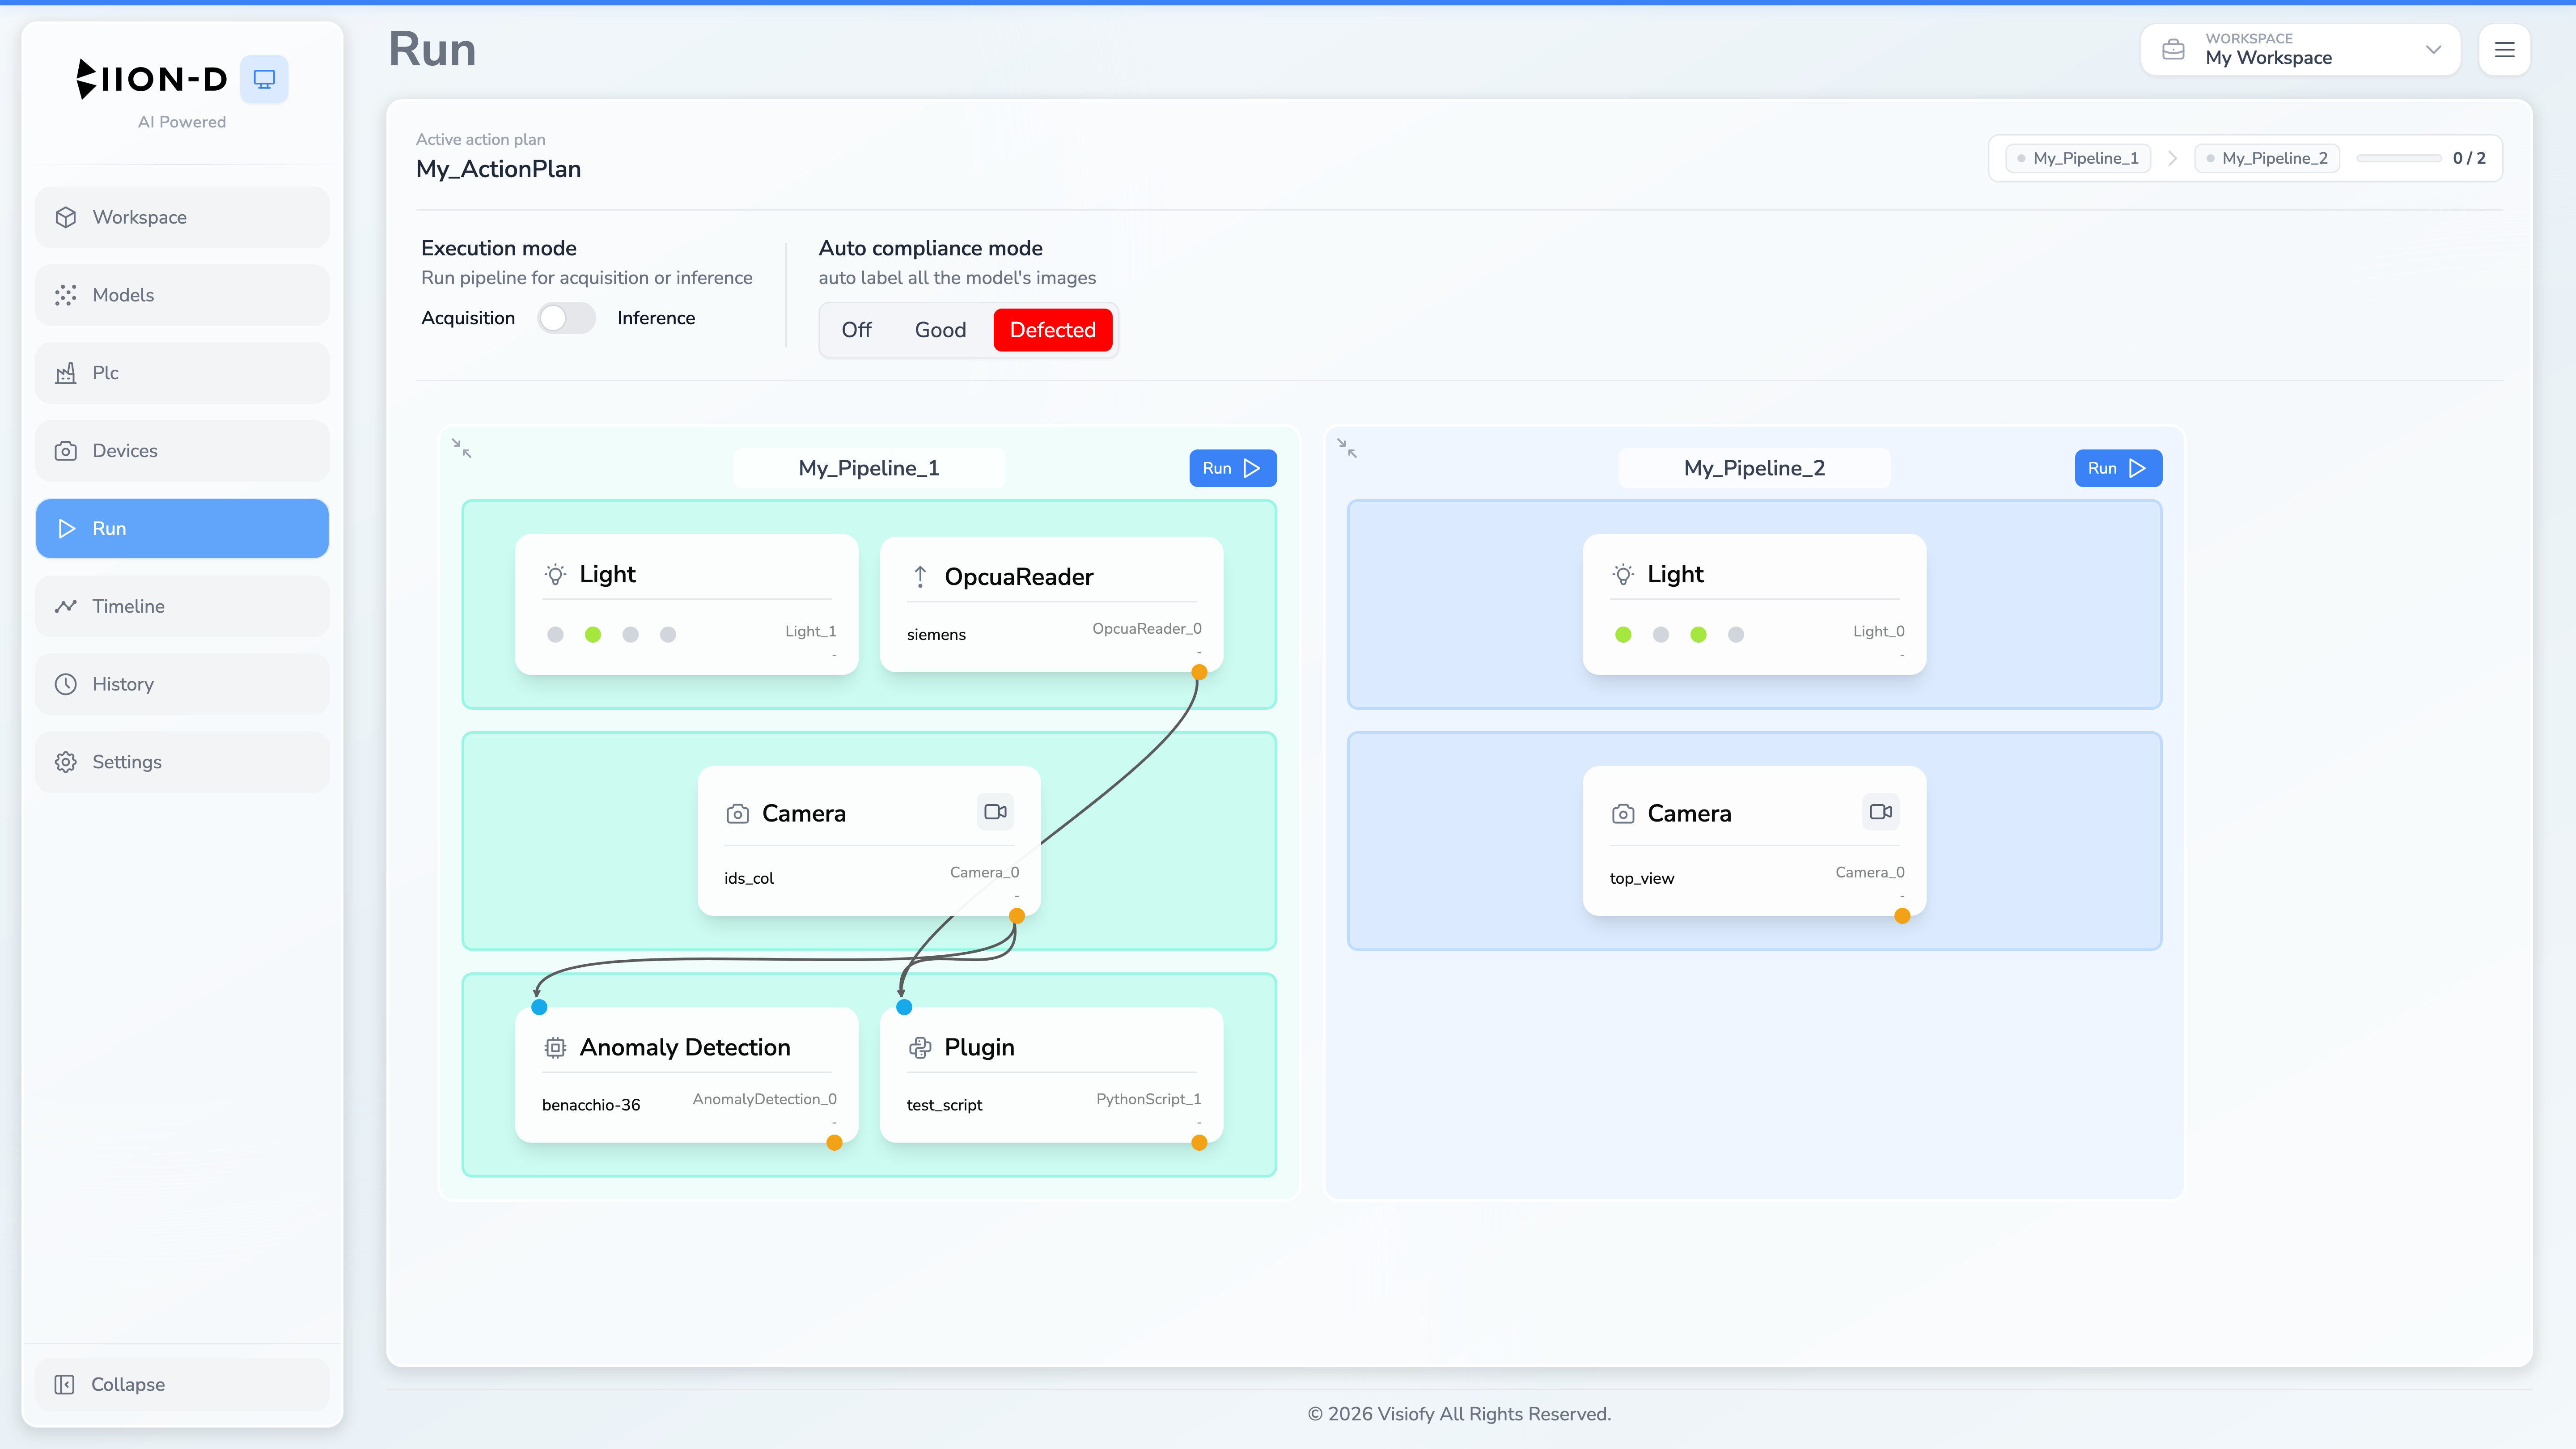
The Run page lets you execute the active action plan’s pipelines one at a time, preview live camera feeds and review results inline.
Prerequisites
Before using the Run page, ensure:
- A workspace is loaded with at least one action plan
- The desired action plan is set as active (see Workspace)
- Required devices (cameras, lights) are connected and enabled (see Devices)
Execution Modes
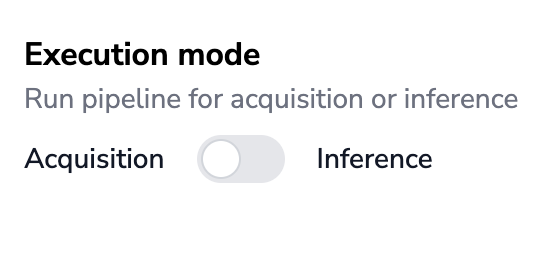
The Run page supports two execution modes, controlled by the Acquisition / Inference toggle:
Acquisition Mode
Captures images from cameras and stores them in the dataset. Used for collecting training data.
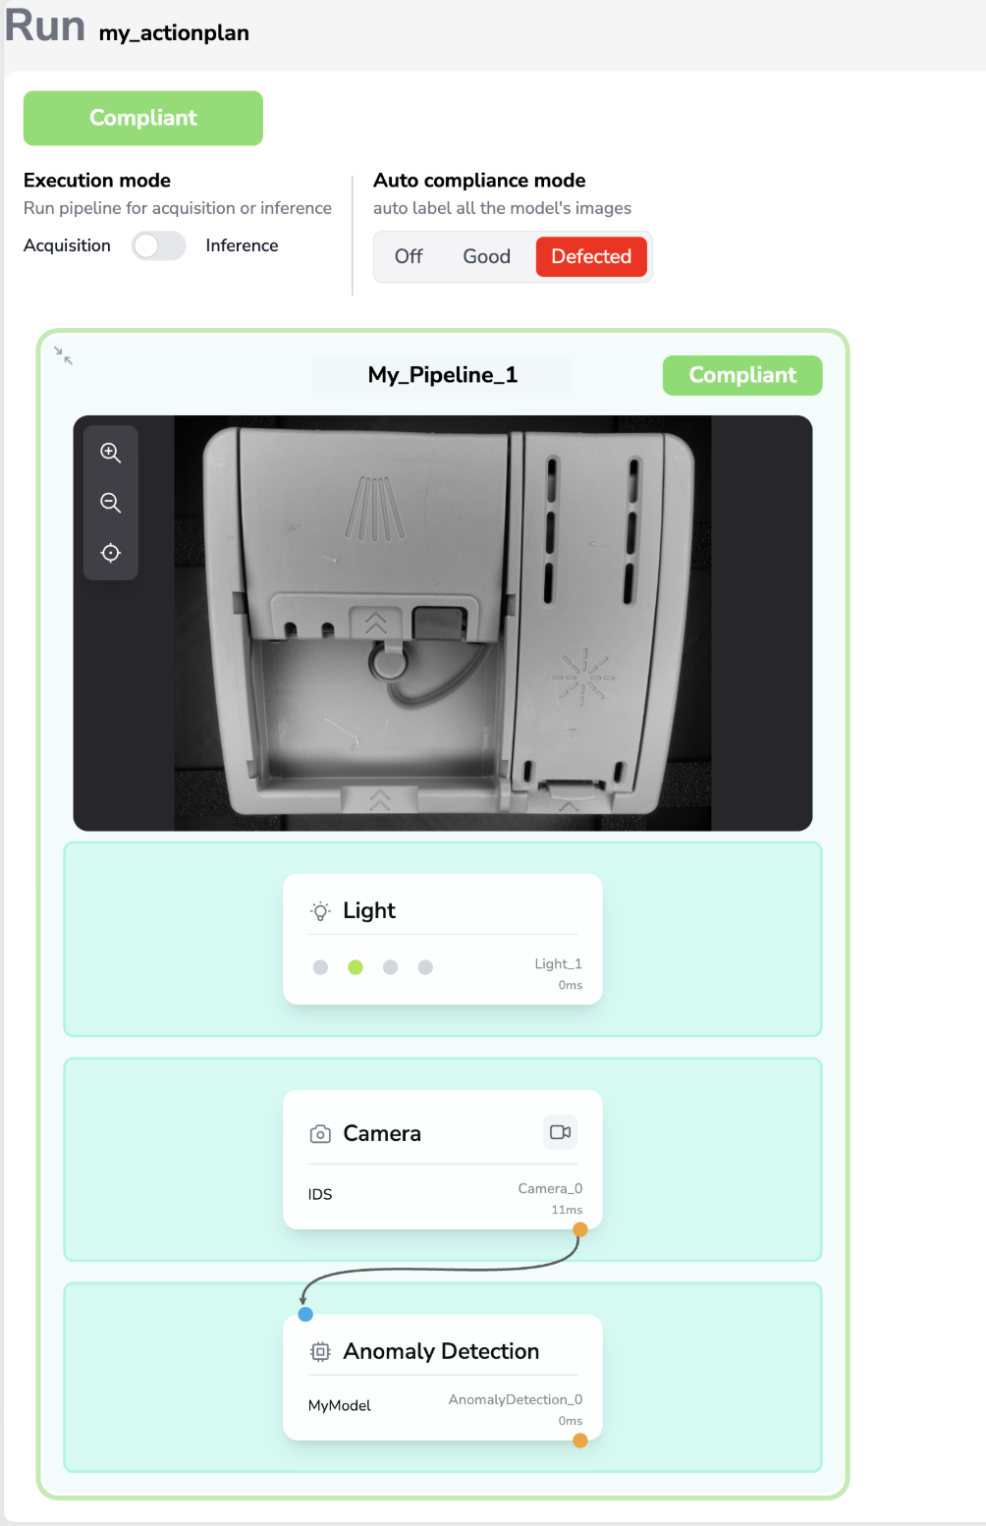
When in acquisition mode, an Auto compliance option is available to automatically label every captured image.
In acquisition mode, a green “Compliant” badge and green pipeline border simply indicate that the image was captured successfully. They do not affect the compliance label assigned by the Auto Compliance setting.
Inference Mode
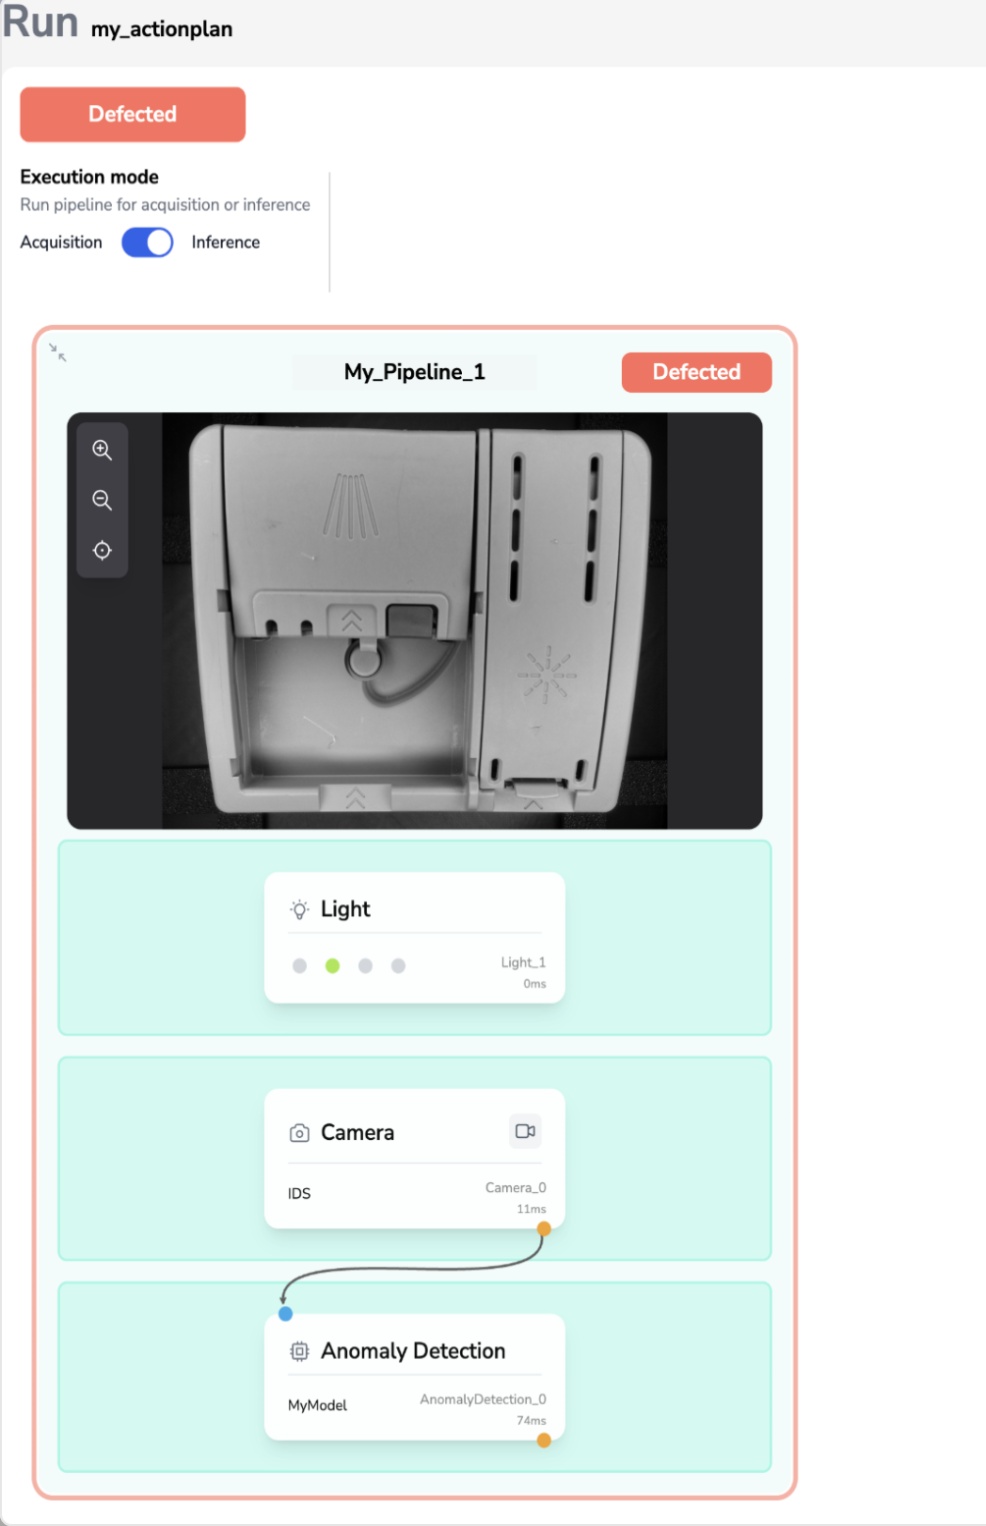
Runs the full inspection pipeline including AI model inference. Used for production inspection.
The auto compliance option is hidden in inference mode.
In inference mode, the compliance badge and pipeline border reflect the actual inspection result: green with “Compliant” if no defect was detected, or red with “Defected” if the model identified a defect in the image.
Auto Compliance
When in Acquisition mode, you can enable auto compliance labeling:
| Option | Description |
|---|---|
| Off | No automatic labeling — images are stored as unknown |
| Good | All captured images are automatically labeled as compliant |
| Defected | All captured images are automatically labeled as defected |
The selector is displayed beside the execution mode controls.
Running a Pipeline
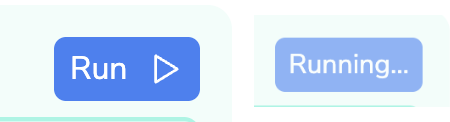
Each pipeline displays a Run button. Click it to execute that specific pipeline.
Click Run
Click the Run button next to the pipeline you want to execute. The control is disabled and shows progress while the request is active.
Multi-pipeline widget
The multi-pipeline widget shows which pipelines in the active Action Plan have run. Complete every pipeline in the Action Plan before running any pipeline again.

View Results
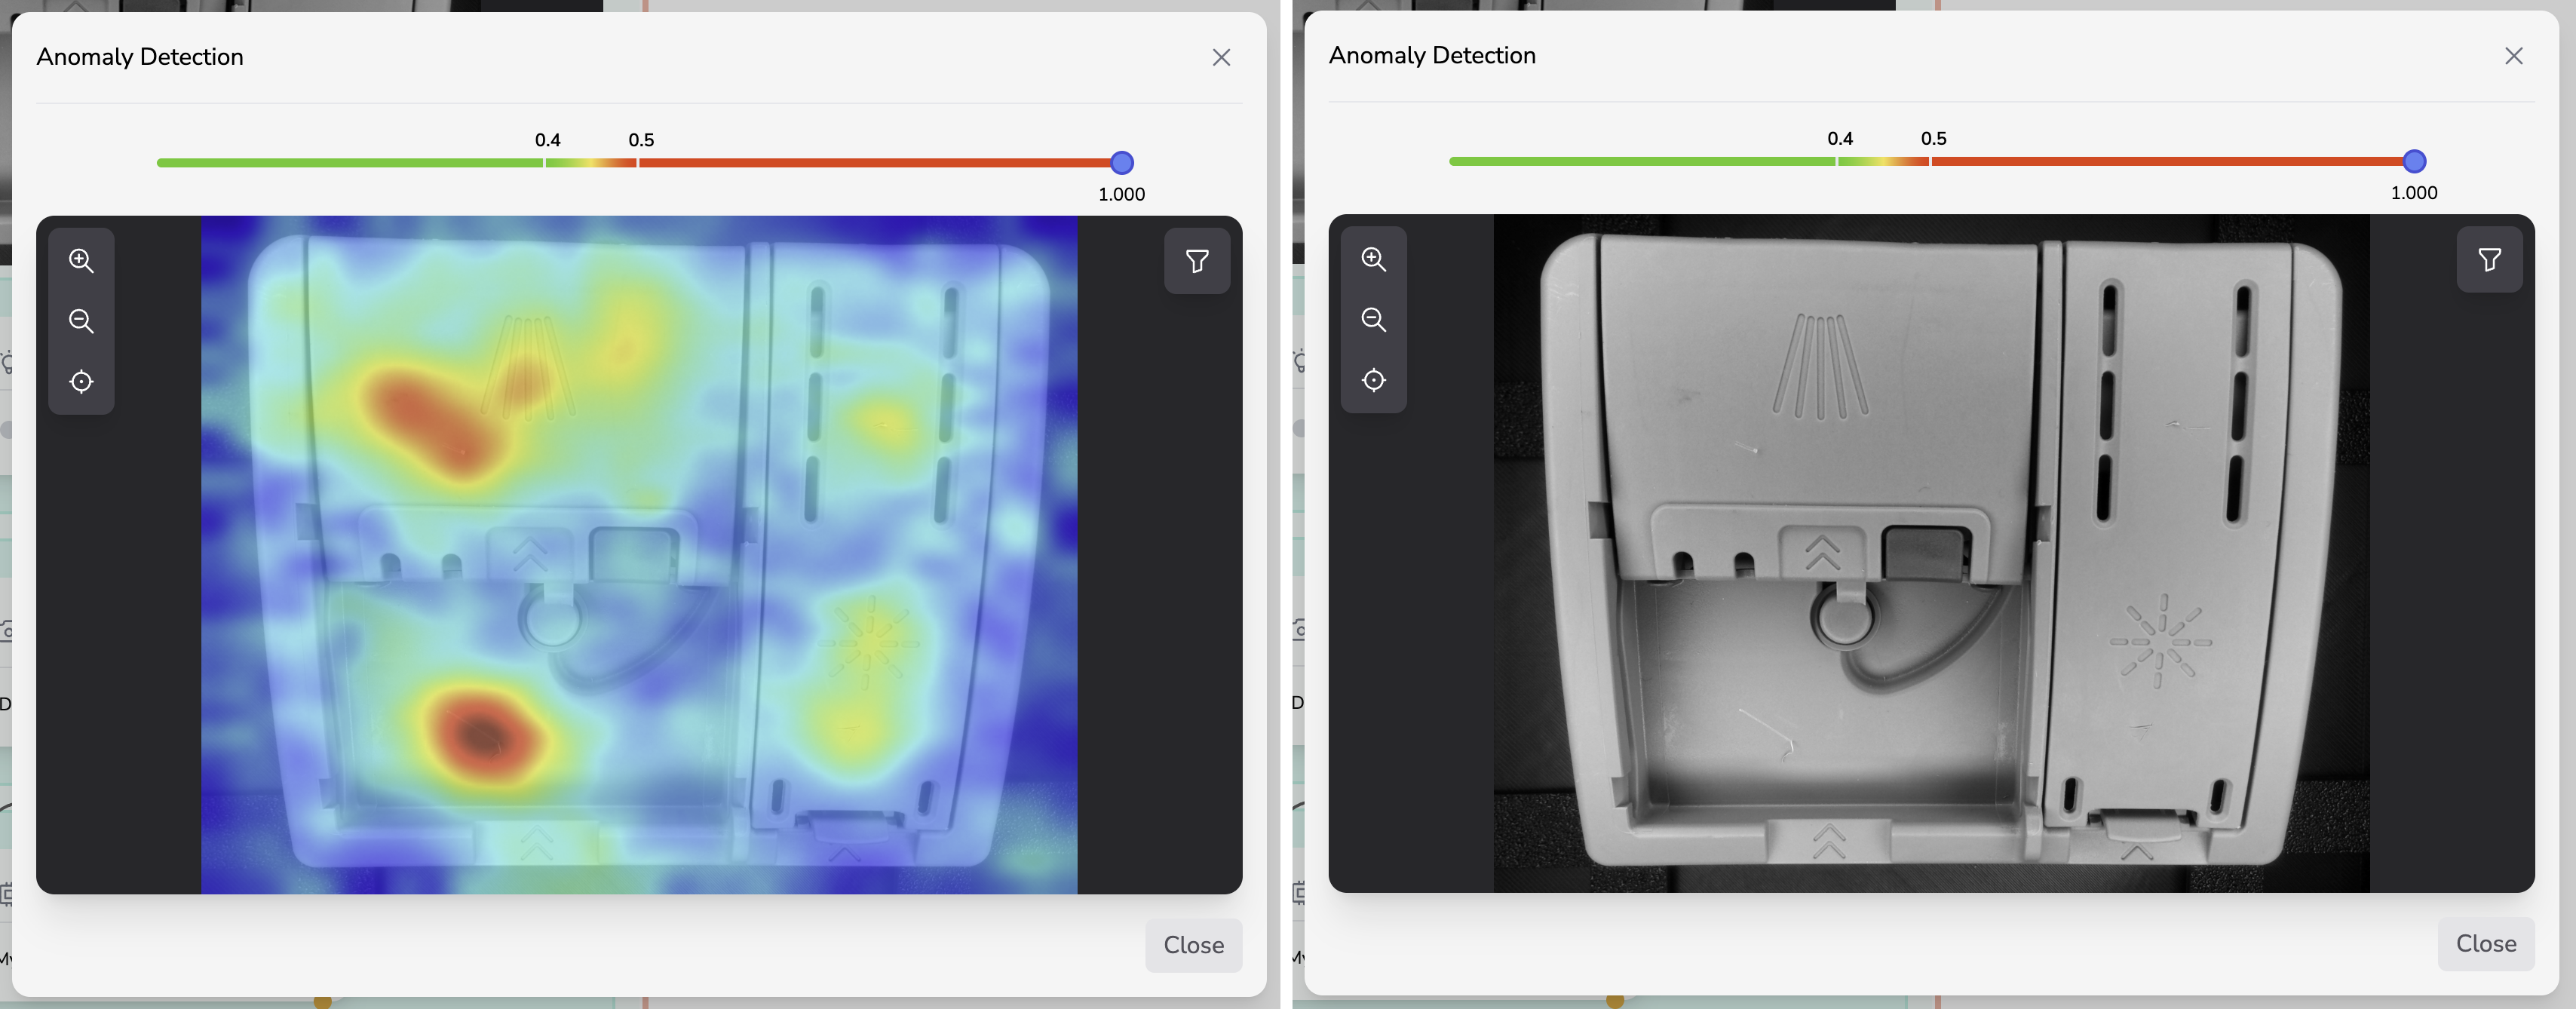
Once execution completes, results are displayed inline on each module in the pipeline visualization. Compliance status (good / uncertain / bad) may be shown depending on the pipeline output.
In inference mode, select an inferencer module to open its available visual result. Anomaly Detection can show the original image or heatmap; Object Detection shows boxes and labels.
Continue the Cycle
When an Action Plan contains multiple pipelines, run each pipeline once. You can run pipelines again only after the full Action Plan is complete.
Live Camera Preview
If your pipeline contains camera modules, a video icon button appears on each camera module. Click it to open a floating live preview panel showing the real-time camera feed.
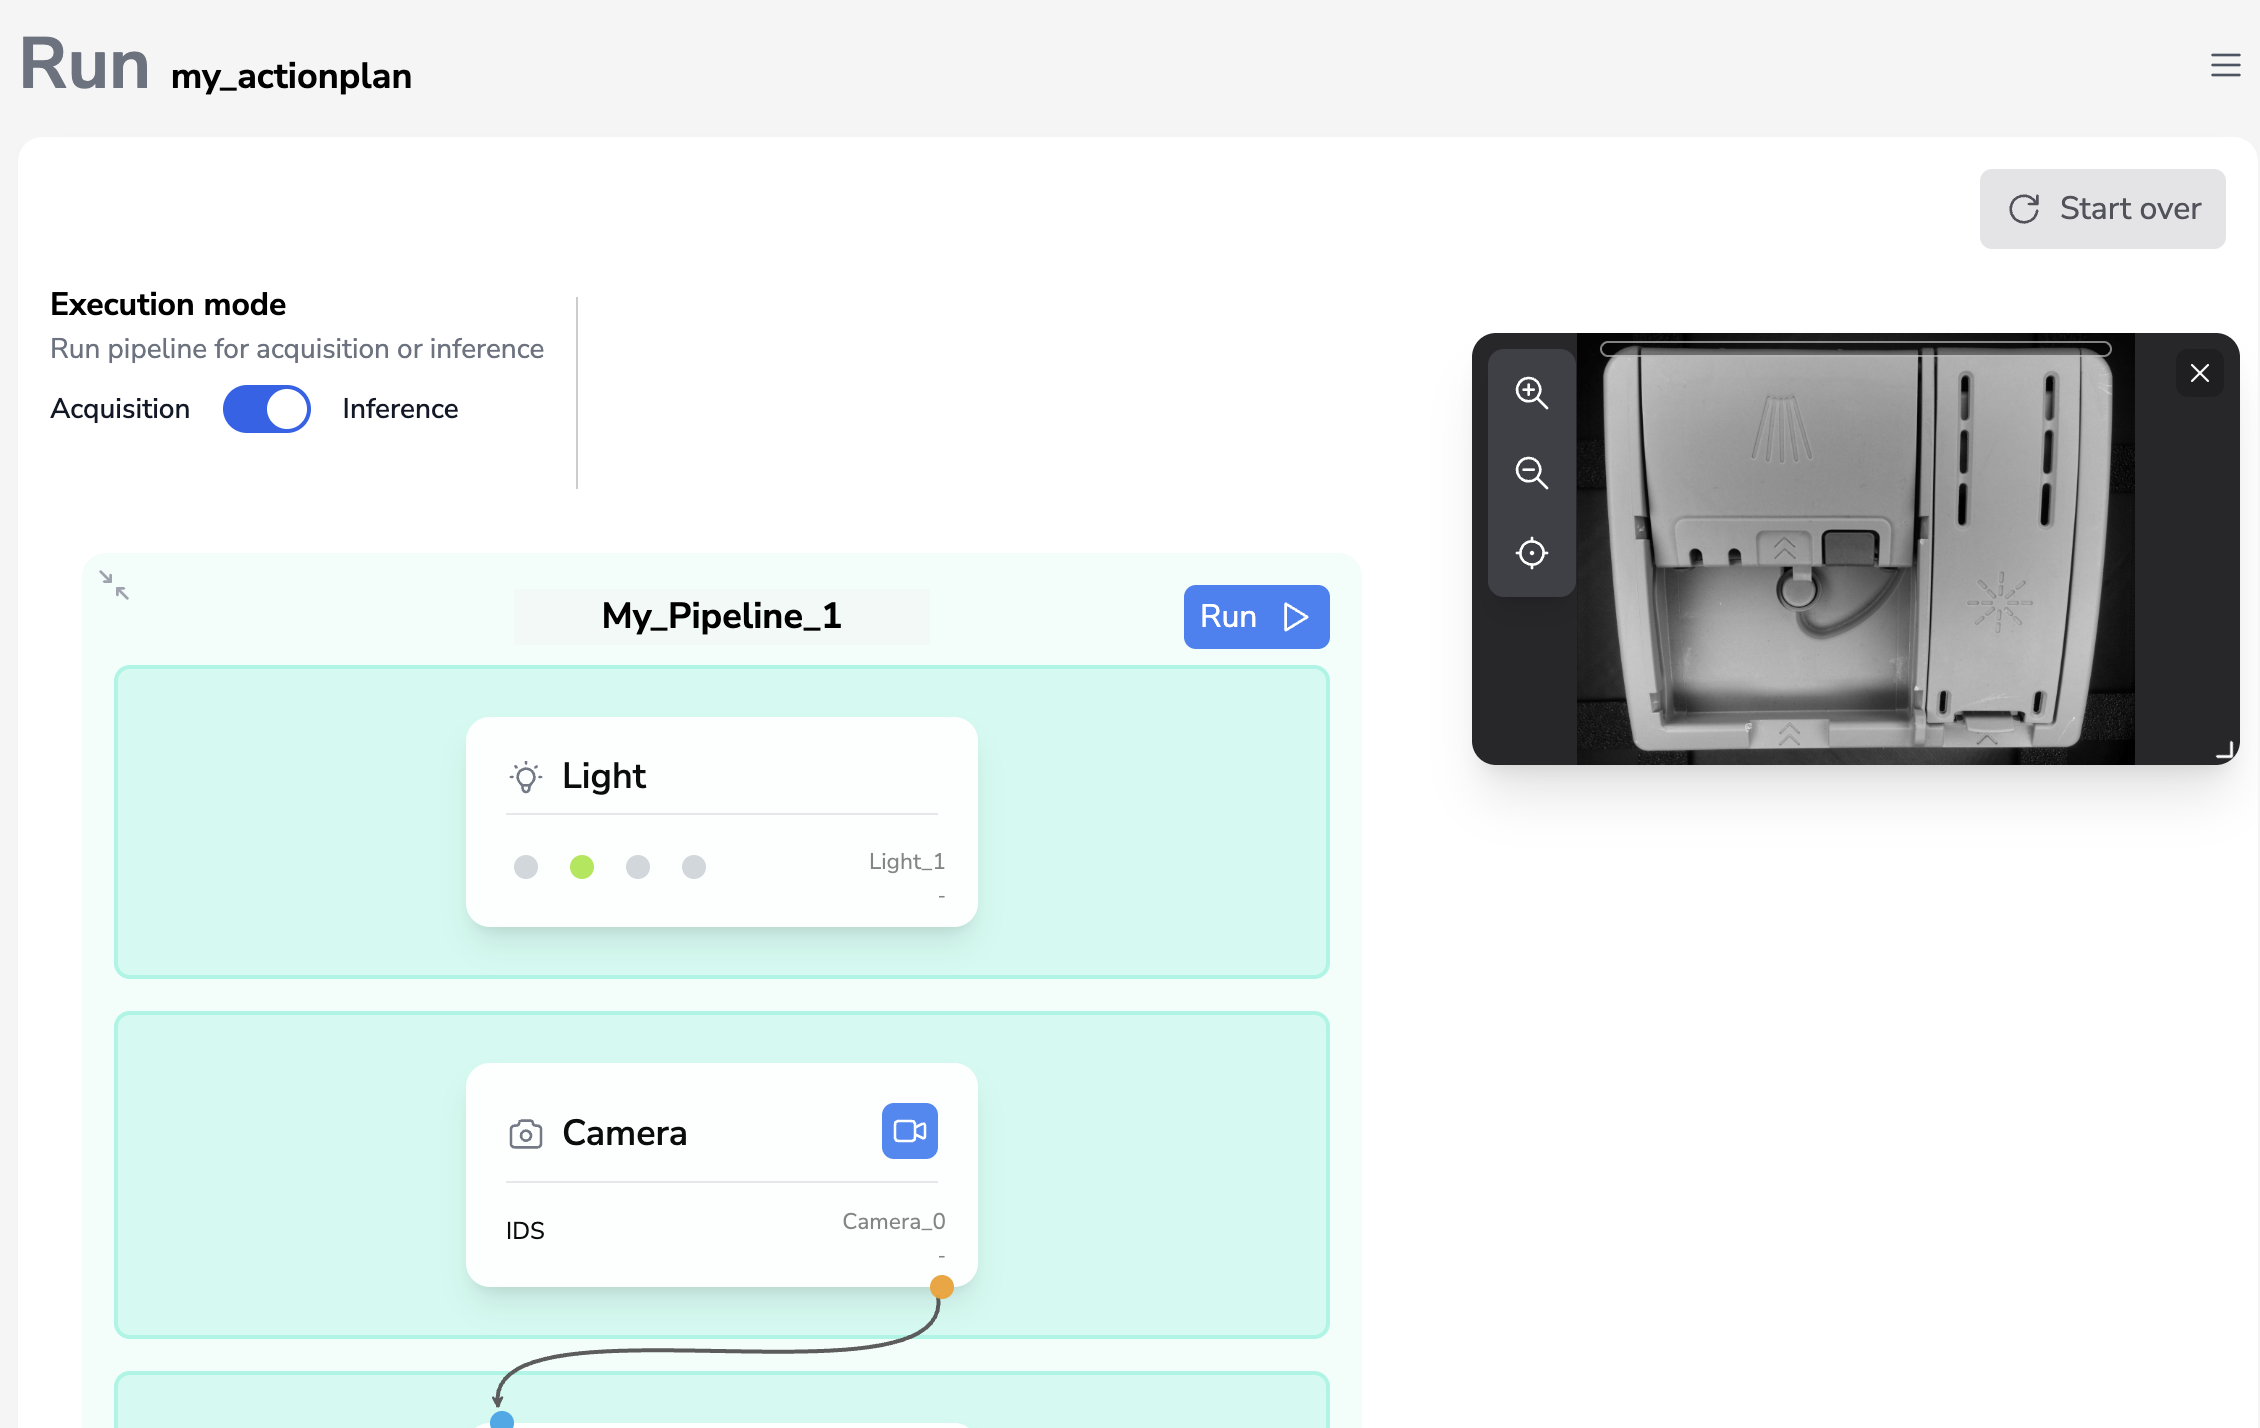
Open live camera previews are restored when you revisit the page in the same browser.
- Click the video icon on another camera module to open its preview.
- Click the × button on the floating panel to close it and release the camera stream.
Overall Compliance
After running a pipeline, the top area shows an overall compliance indicator for the most recent execution.
Keyboard and Behavior Notes
- The execution mode and auto compliance selections are persisted in your browser. They will be restored next time you visit the page.
- If a previous run was interrupted (started but not finished), the Run page will attempt to restore its partial results.
- Navigating away from the page automatically stops any active camera streams.
Streaming Action Plans use Start and Stop controls instead of individual frame runs.