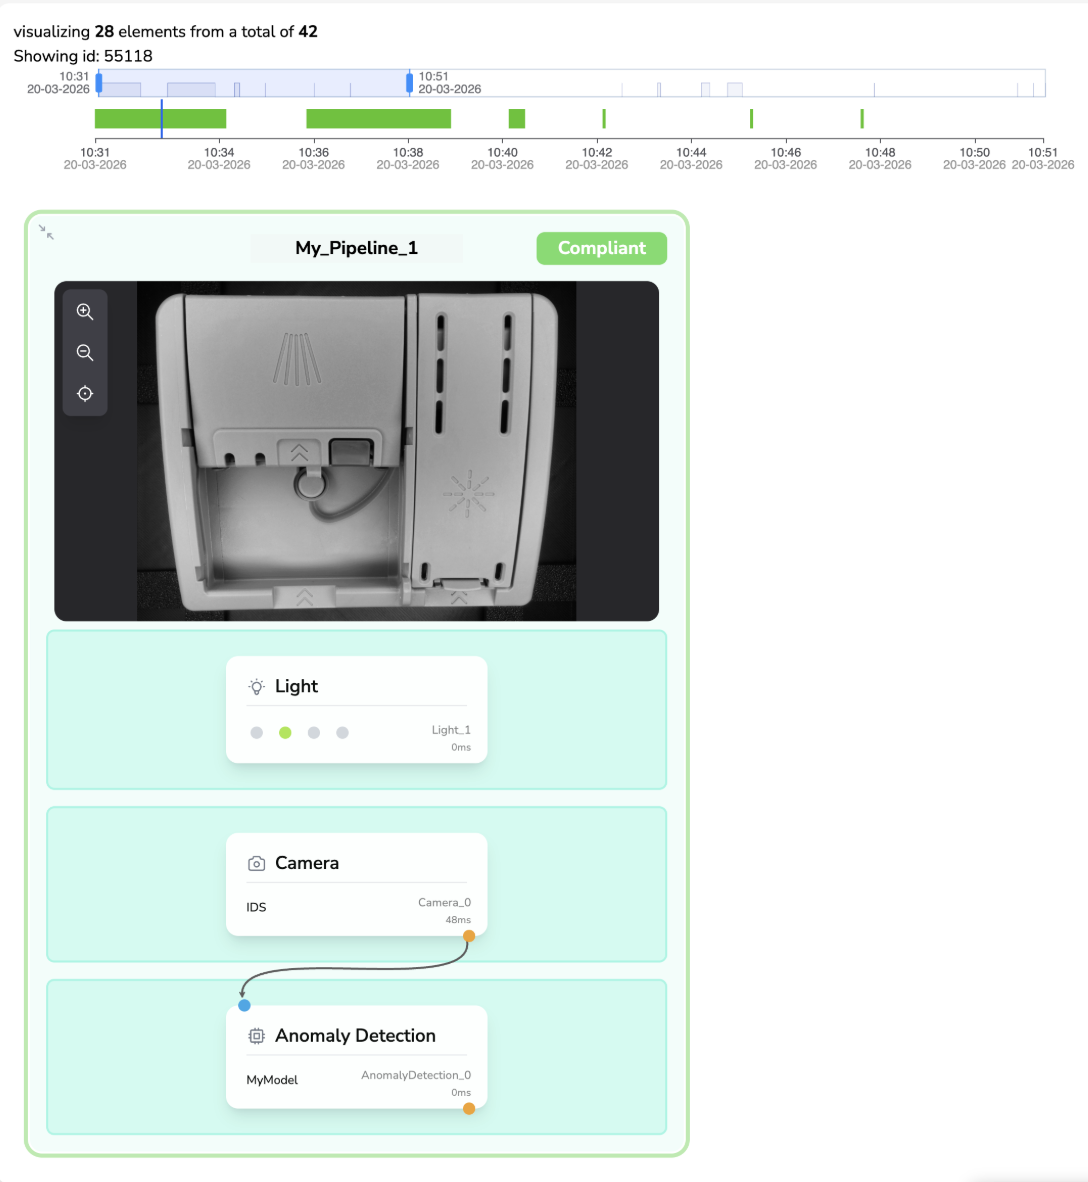
Timeline
Visualize pipeline execution results on an interactive timeline chart.
The Timeline page provides a visual, time-based representation of pipeline execution results. It uses an interactive chart to display inspection data over configurable time ranges.
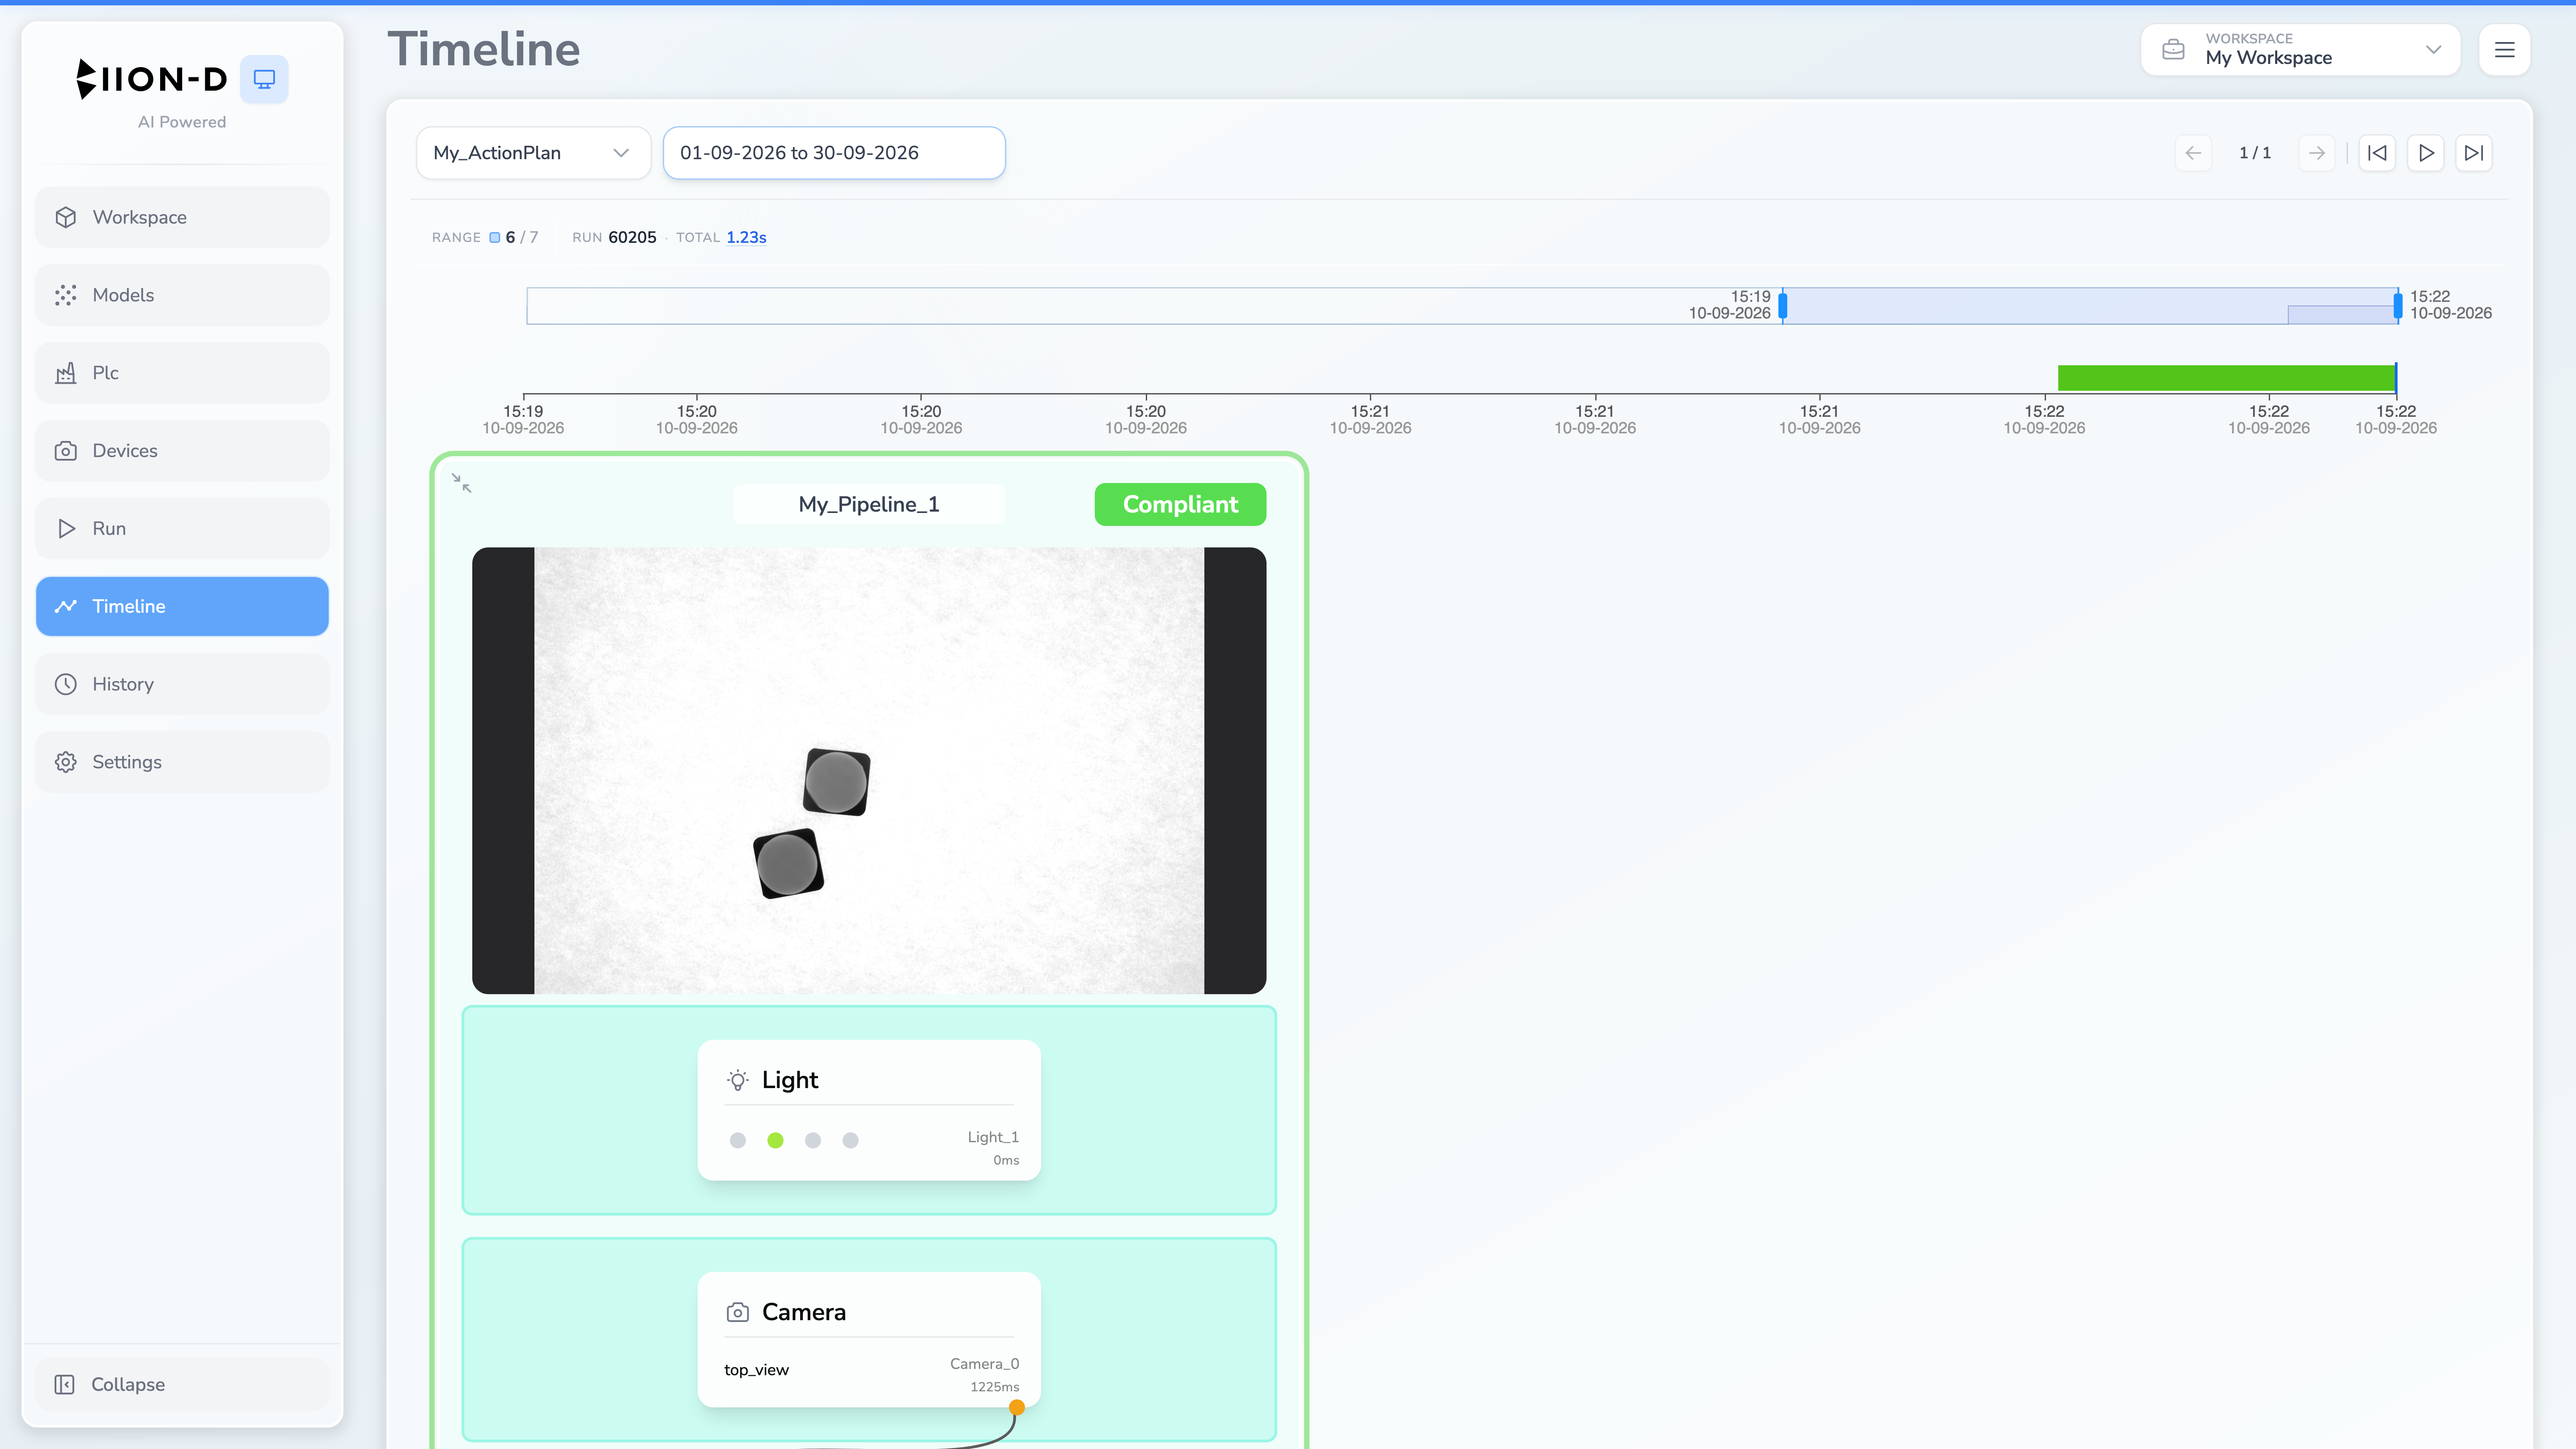
Controls
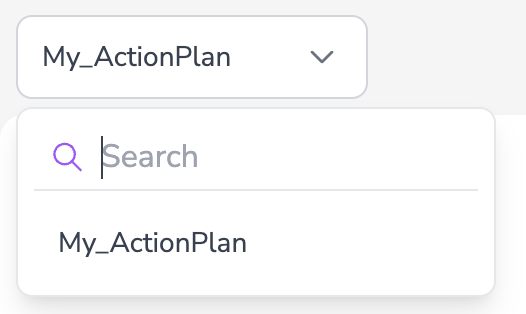
Action Plan Selector
Use the dropdown in the top left to select which action plan’s results to display. By default, the currently active action plan is pre-selected.
Date Range Picker
Click the date range input to open a calendar picker. Select a start and end date to define the time window for the timeline.
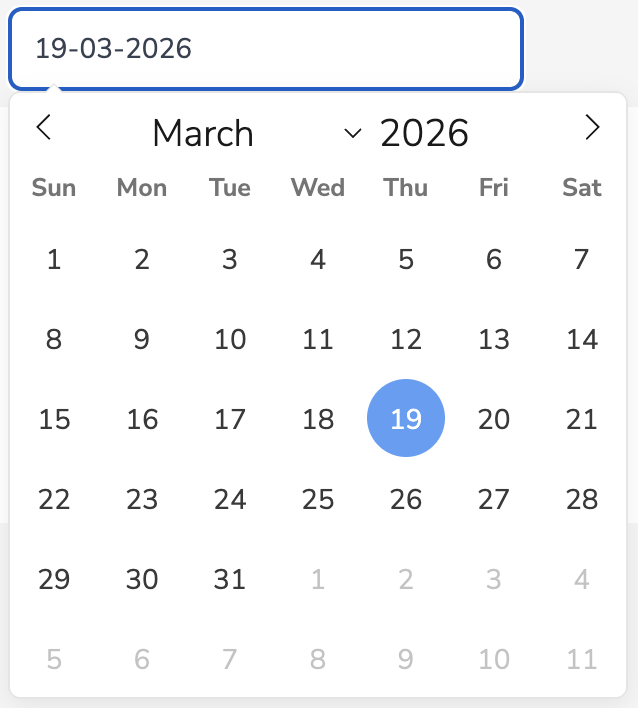
Select both a start and end date for a reliable bounded query.
Navigation Controls
The right side of the controls bar contains navigation buttons:
| Button | Description |
|---|---|
| ← / → (offset arrows) | Load an older or newer page of results |
| ⏮ Previous | Select the previous result |
| ▶ Play / Pause | Automatically move through individual results |
| ⏭ Next | Select the next result |
Timeline Chart
The main area displays an interactive chart powered by ECharts. The chart visualizes execution data as chunked segments over time, allowing you to:
- See when executions occurred
- Distinguish compliance states by color
- Zoom or drag the cursor to a specific result
- Inspect run identifiers, duration and operation timing
Action Plan View
Below the chart, the selected execution is rendered as a read-only Action Plan with its saved module results.